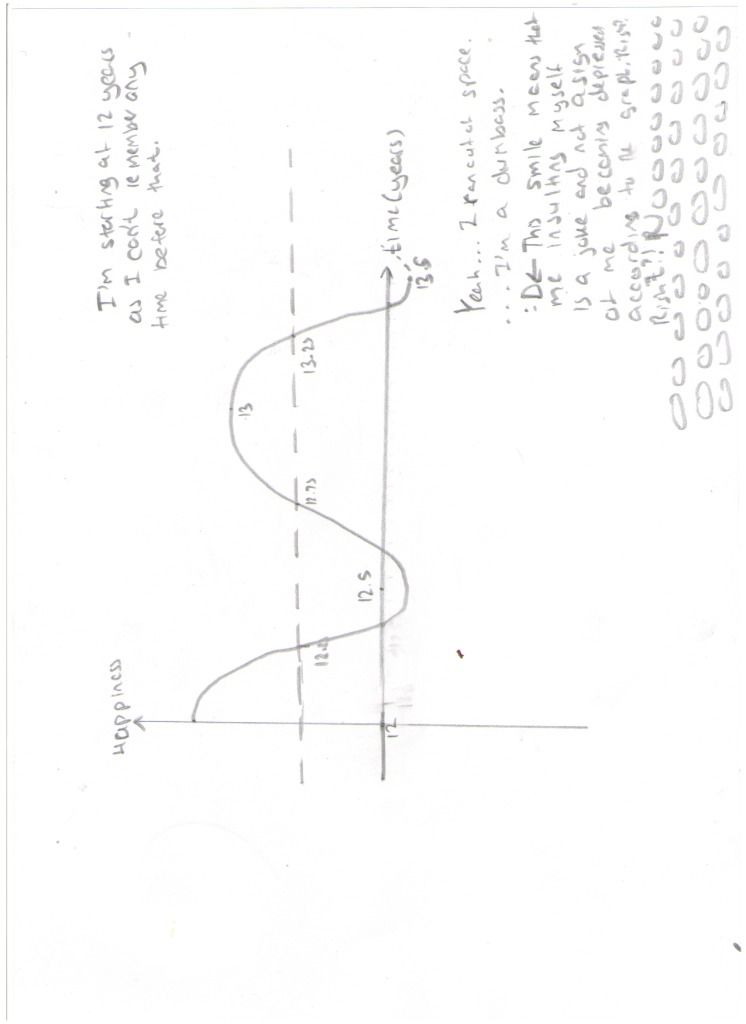
The cosine graph that is my life...or something like that.
The title is kinda misleading. It's not a complete graph of my life...just the level of happiness of it.
Now, onto the fun (maths) stuff.
What I have noticed is that around 12 months ago, I was crazily optimistic, then 9 months later I was happy but not crazy happy, then 3 moths later, I was in this not so bad "depression" and then 3 months later, I was pretty ok, And now everything seems pretty amazing.
And as I've looked further back, it seems that this fluctuating pattern has occurred throughout most of my life (if I remember my life correctly).
Basically a cosine graph(happiness over time), with a period of 1 year, an amplitude of an extreme mood, with a mean happiness value somewhere around a but more happier than I should be.
So it's pretty much looks like this.

Sorry for the size and the lack of scale and and the incorrect rotation. Kinda lazy...
-
 1
1


1 Comment
Recommended Comments
Create an account or sign in to comment
You need to be a member in order to leave a comment
Create an account
Sign up for a new account in our community. It's easy!
Join the herd!Sign in
Already have an account? Sign in here.
Sign In Now