The Maths Return!
And the blog starts with maths... ![]()
Shush, I have no idea how to blog! ![]()
*ahem*
Welcome class! It's time for your favorite thing! MATHS! Isn't that awesome!? It's like the number one thing! ![]() Get it? Number...? ONE..? Maths??? No?
Get it? Number...? ONE..? Maths??? No? ![]() Alright then, let's get to the lesson!
Alright then, let's get to the lesson! ![]() Run away while you can.
Run away while you can.
Joking aside~~
So yeah, some time ago I've posted a status update mentioning some maths to achieve this effect:
Long story short;
I wanted a formula, that raises as gets closer to a certain point, then decreases along with the distance.
The first thing, that came to my mind was a quadratic function, because their graphs seemed to be similar to what I was looking for. You may have seen these parabolas, where it was raising to some point, then going down. Just by that image my mind suggested me something...
"Hey, what if the top of the parabola would be the center and then the value would be decreasing the further it goes from that point? Wouldn't be that what you're looking for?"
And I was like
"Yeah! That should work!" ![]()
Even though I was thinking of some other possibilities, that would be even better (we'll get to this later), I decided to stick to my very first thought. (silly me, told ya I tend to unnecessarily make things more complex than they should ![]() )
)
So I've started thinking of a formula, that would do what I want and after some time I came up with this:
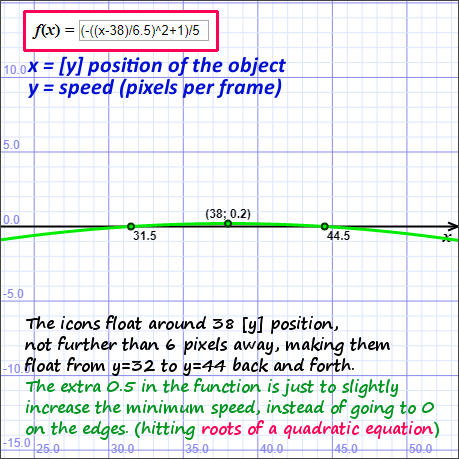
>>> Putting into game...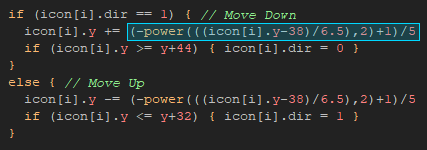
What this formula does is to get the "Y" value from the function based on the icon position.
So point x=38 on the graph is where I want to put icons. Now I'd like to give them a smooth floating animation. To do that, I've decided to move them up and down by up to 6 pixels away from the center. It could be achieved in a really simple way, like move it up with a constant speed, then bounce it back and forth, with the same speed. Heh, that's actually what I did in my previous design ages ago...
That doesn't look bad, that's true. Thanks to very low distance (6 pixels in total; 3 from center), it's not really noticeable. It's just few pixels up/down after all.
Now that I'm working with a larger resolution, it would be nice to make it actually smooth and that's what the formula does. As you can see, the further the icons move from the center (x=38 on graph) the lower the value gets, which is what I needed.
So I've used that fancy calculation then moved the icons by the returned amount, eventually changing their direction when getting far enough.
That was a success.
The formula did exactly what I wanted.
However, there was a much simpler and more automatic way to achieve this. There is a similar graph, but instead of parabola, there's a wave.
Now since the wave doesn't end and goes up/down through positive and negative values all by its own, it could be easily used to replace a pretty big chunk of code.
Now guess what that wave is... Have you ever heard of sines?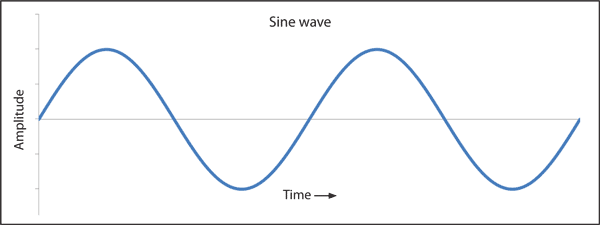
Sounds like another silly thing to learn during math classes, but turns out these actually have some usage! ![]()
It pretty much follows the same idea-
The horizontal line showing point 0 would be the center. Now as seen in the graph, it goes up and down with time.
At this point I could forget about the previous 'if' statements and all that stuff and just use the time and some maths of course.
I wanted to see how it all behaves in the software I use, so for some testing I've created a thingie, that draws the waves based on thrown formula, so brace yourselves, I present you the SINE SIMULATOR 2018! (also supports other functions, but who cares) ![]()
Let's try the simplest one- the one shown in the image above.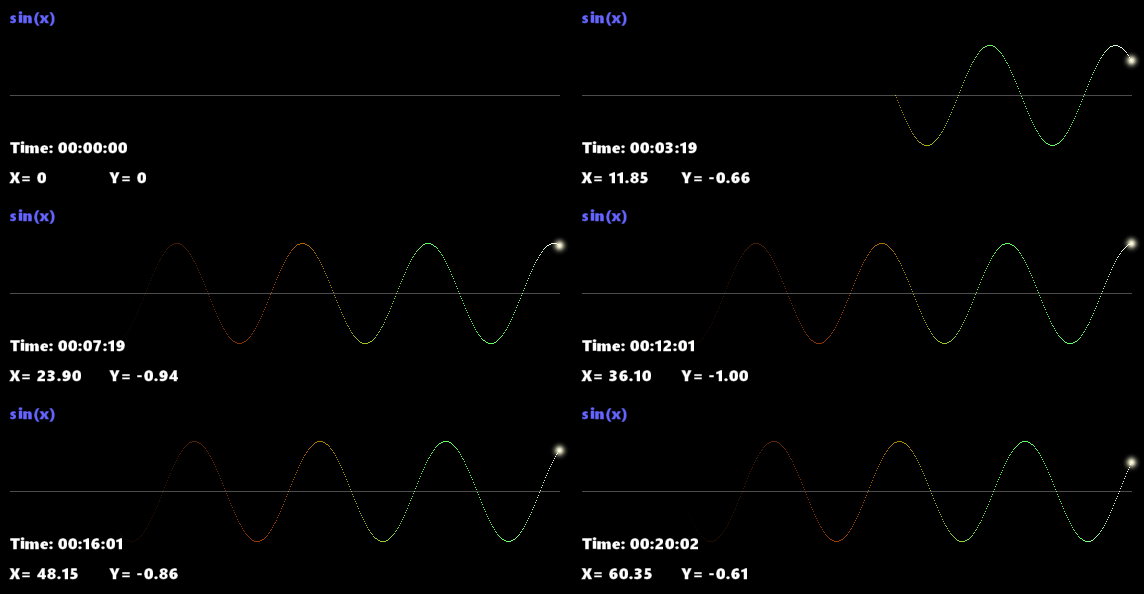
Oh that's sooooooo coooool! It lacks of ponies though, I should have put some... Everything works. ![]()
Also some other example (suggested by fellow developer in chat)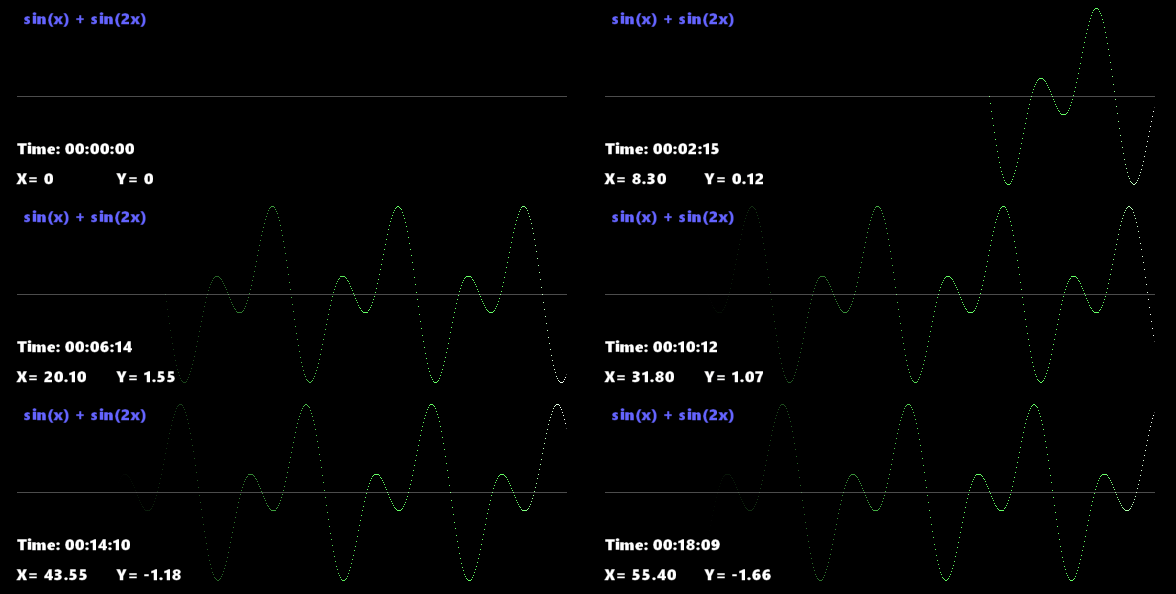
![]() -{ Uuuuuh fancy! )
-{ Uuuuuh fancy! )
I know, right? ![]()
Still lacks of ponies though, perhaps in future updates of that useless program-thingie...
Okay, so all I had to do was to follow the damn train, CJ - not this again, my bad! ![]() --- Was to use these values for the icons.
--- Was to use these values for the icons.
For that, I came up with a pretty much the same formula as before, but using sines this time.
icon[i].y = 38 + 6 * sin(icon[i].timer);
icon[i].timer += 0.05
So basically:
38 - is the center
6 - is the amplitude - the maximum distance they can travel from the center
and then the timer (0.05) - basically represents the x position increment in each frame - the higher the value, the faster it goes.
So yeah, the code has been shrunk to only two lines and it gives an extremely accurate result! ![]()

The only one question is... Why did I waste the whole weekend on toying with this! ![]() Such a relatively simple thing, a tiny piece of code, yet I had to do science for hours anyways...
Such a relatively simple thing, a tiny piece of code, yet I had to do science for hours anyways... ![]()
Well, either way... ![]()
And with that being said, you're free to go now! ![]() If you haven't run away already.
If you haven't run away already. ![]()
-
 6
6


9 Comments
Recommended Comments
Create an account or sign in to comment
You need to be a member in order to leave a comment
Create an account
Sign up for a new account in our community. It's easy!
Join the herd!Sign in
Already have an account? Sign in here.
Sign In Now